 “Talk is cheap” – my Dad used to say this to me, if I told him I was going to do my chores but didn’t do them. It was a fair challenge to my teenage self! It’s ok to have good intentions, but if we don’t act to back up what we say, then our words are meaningless. One of my most recent blogs explored what we can do to tackle poverty and health inequalities. One of the things I didn’t focus on, but which deserves a blog all to itself is the inequality caused by and the social injustice which is perpetuated by the funding formula used within the NHS. I will demonstrate, using a few examples why this formula is so antiquated and suggest that the ‘Morecambe Bay Formula’ which we have developed might be a better model for the future if we want to put our money where our mouth is! I’m sure with Boris Johnson’s ‘levelling up’ agenda, that the time has come for us to take this seriously.
The current Carr-Hill Formula takes into consideration various factors. Generally it’s what we call a weighted-population formula and distributes money and resources according to various complex factors but puts insufficient weighting on the issue of deprivation. What this means in practice is that wealthier areas (like the South East) have significantly more money, per head of population, spent on them than areas (like the East Midlands or the North West), where poverty rates are much higher and health outcomes are significantly worse.
Let me give you two examples from here in Morecambe Bay as to how that makes little or no sense if we are serious about levelling up.
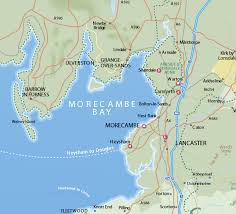
Here are a couple of graphics showing how life expectancy changes along two different bus routes around Morecambe Bay (recognising that these are averages within these towns and are significantly worse within some more localised wards):
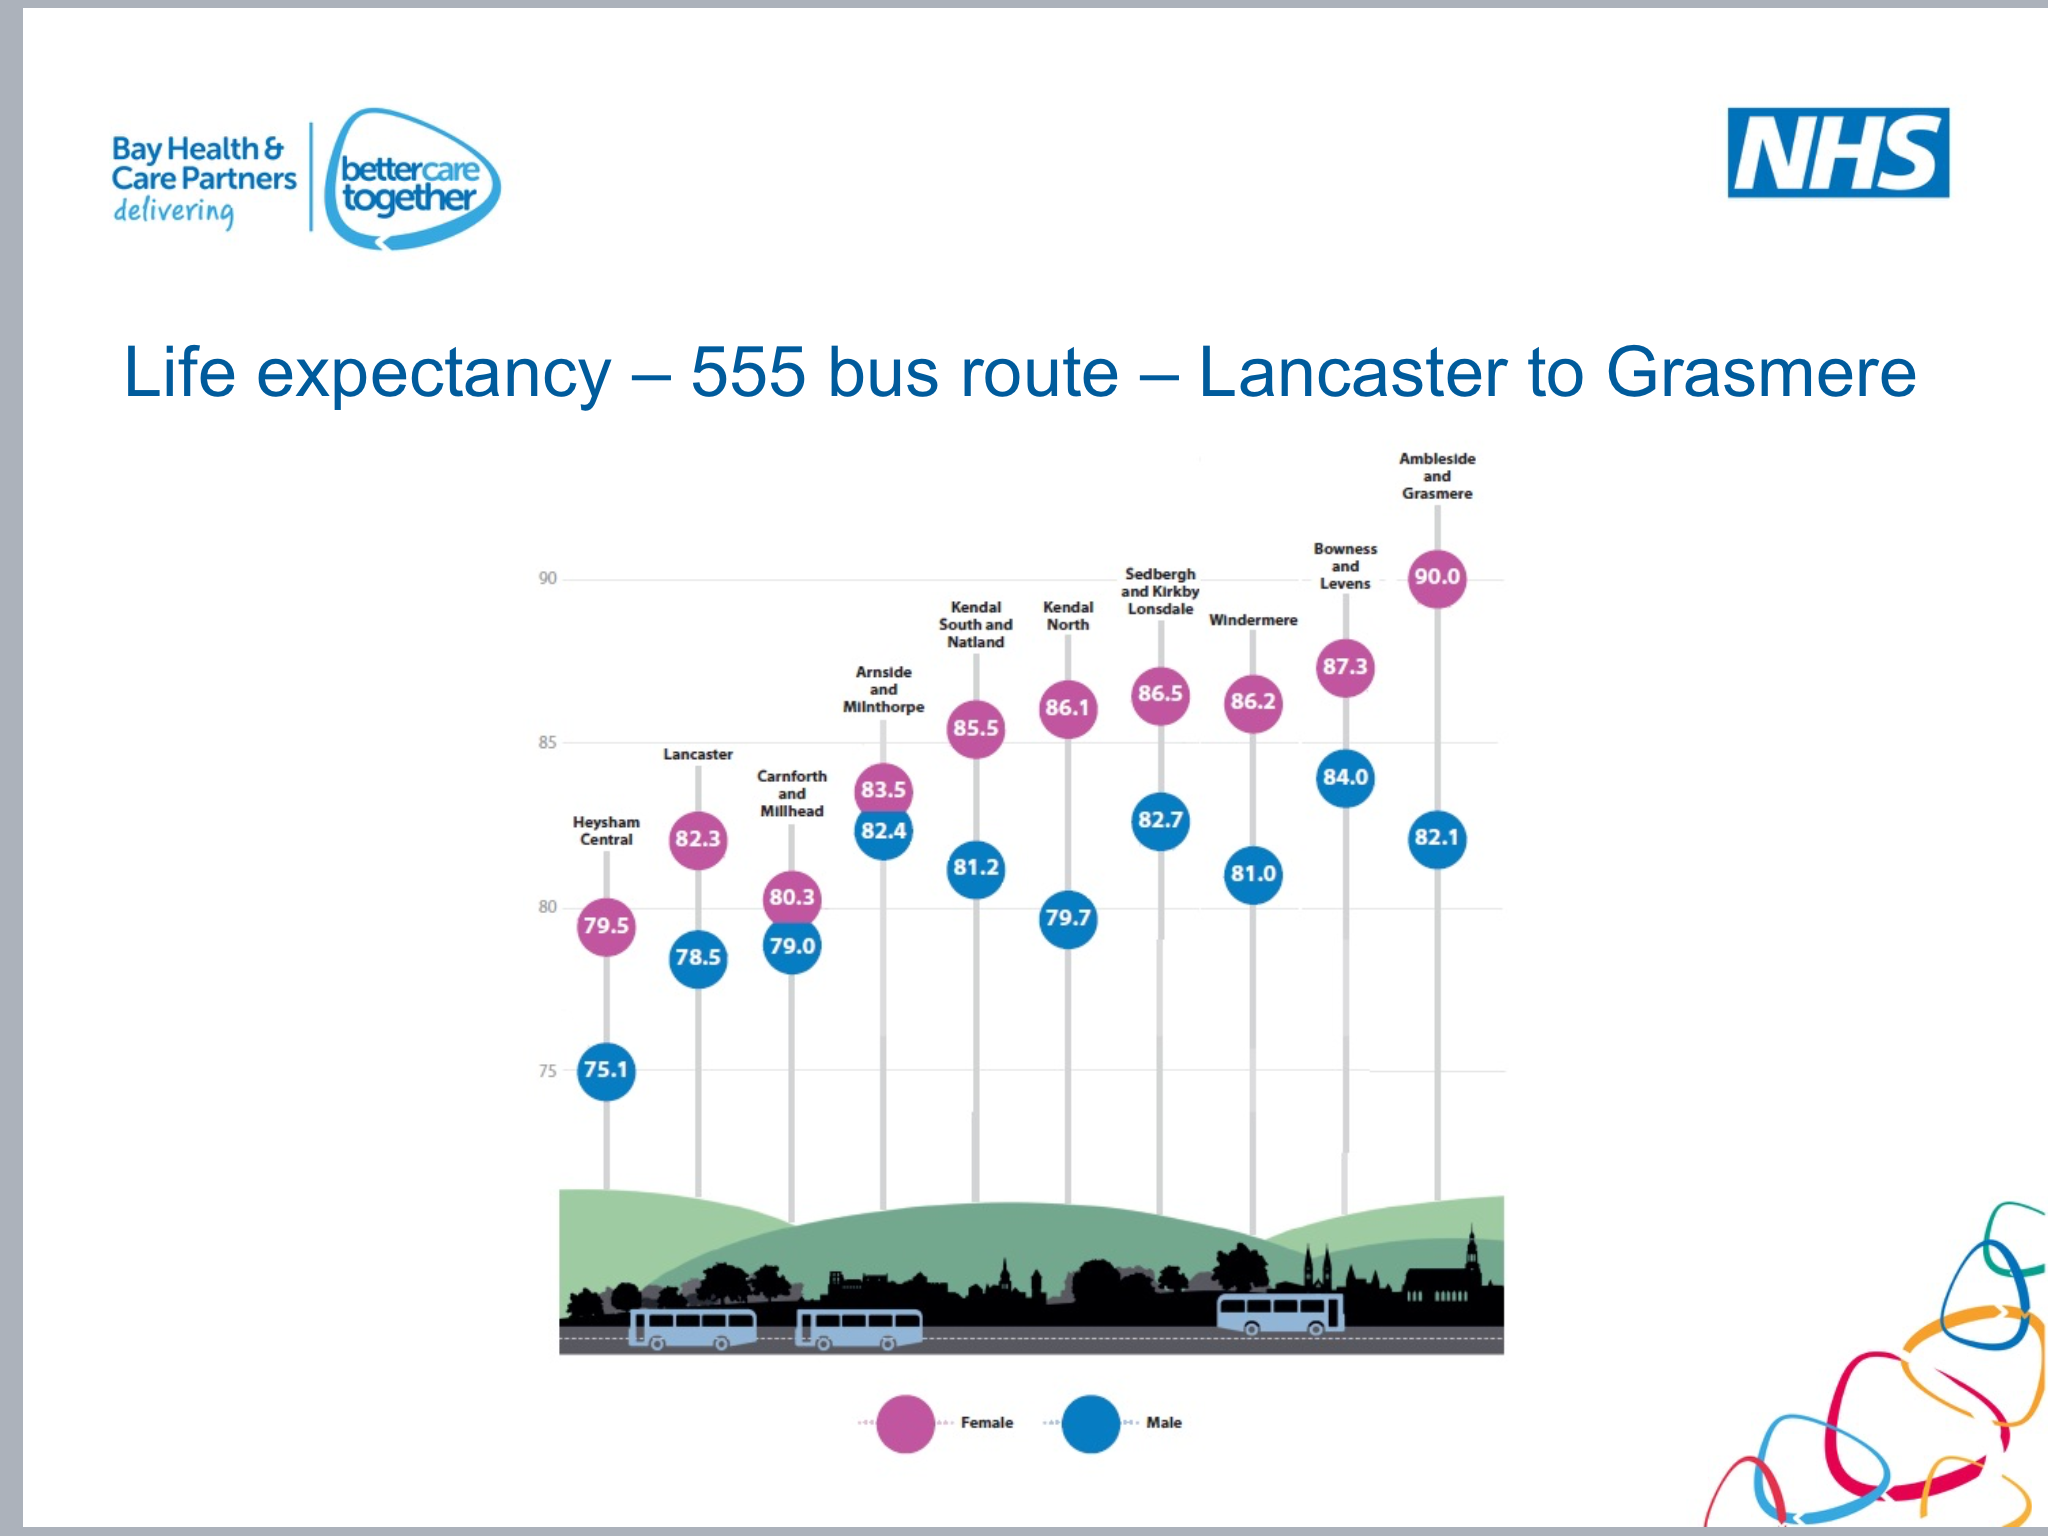

You can see the stark differences in life expectancy between people who live in Barrow-in-Furness and those who live in Ambleside, or those who are in Heysham compared to those in Levens. People in our areas of 10-20% lowest Index of Multiple Deprivation (IMD) are dying 10-15 years earlier than their counterparts in our wealthiest wards. Surely we care enough about this to want to change things?!
 So, our team did a little exercise in which we thought together about how we might spend £500k, if we were going to try and ‘level up’. Our Bay, is broadly divided into three districts. The Furness Peninsula, South Lakeland and Lancaster District (which is basically North Lancashire). We divided the area up according to the lowest 10% IMD and distributed the money accordingly, knowing the kind of projects we could invest in to make a difference to people’s life expectancy and wellbeing. The results were stark! We found that out of £500k, we would spend around £232,000 in the Furness area (predominantly wards in Barrow and Millom), £267,000.50 in Lancaster District (predominantly Morecambe/Heysham and some wards of Lancaster) and just under £500 in South Lakeland! £500 out of half a million! But that’s how stark the differences are in our Geography of around 1000 square kilometres. When we then changed this formula to be based on our lowest 20% IMD areas, the South Lakes still only ended up with just over £1000.
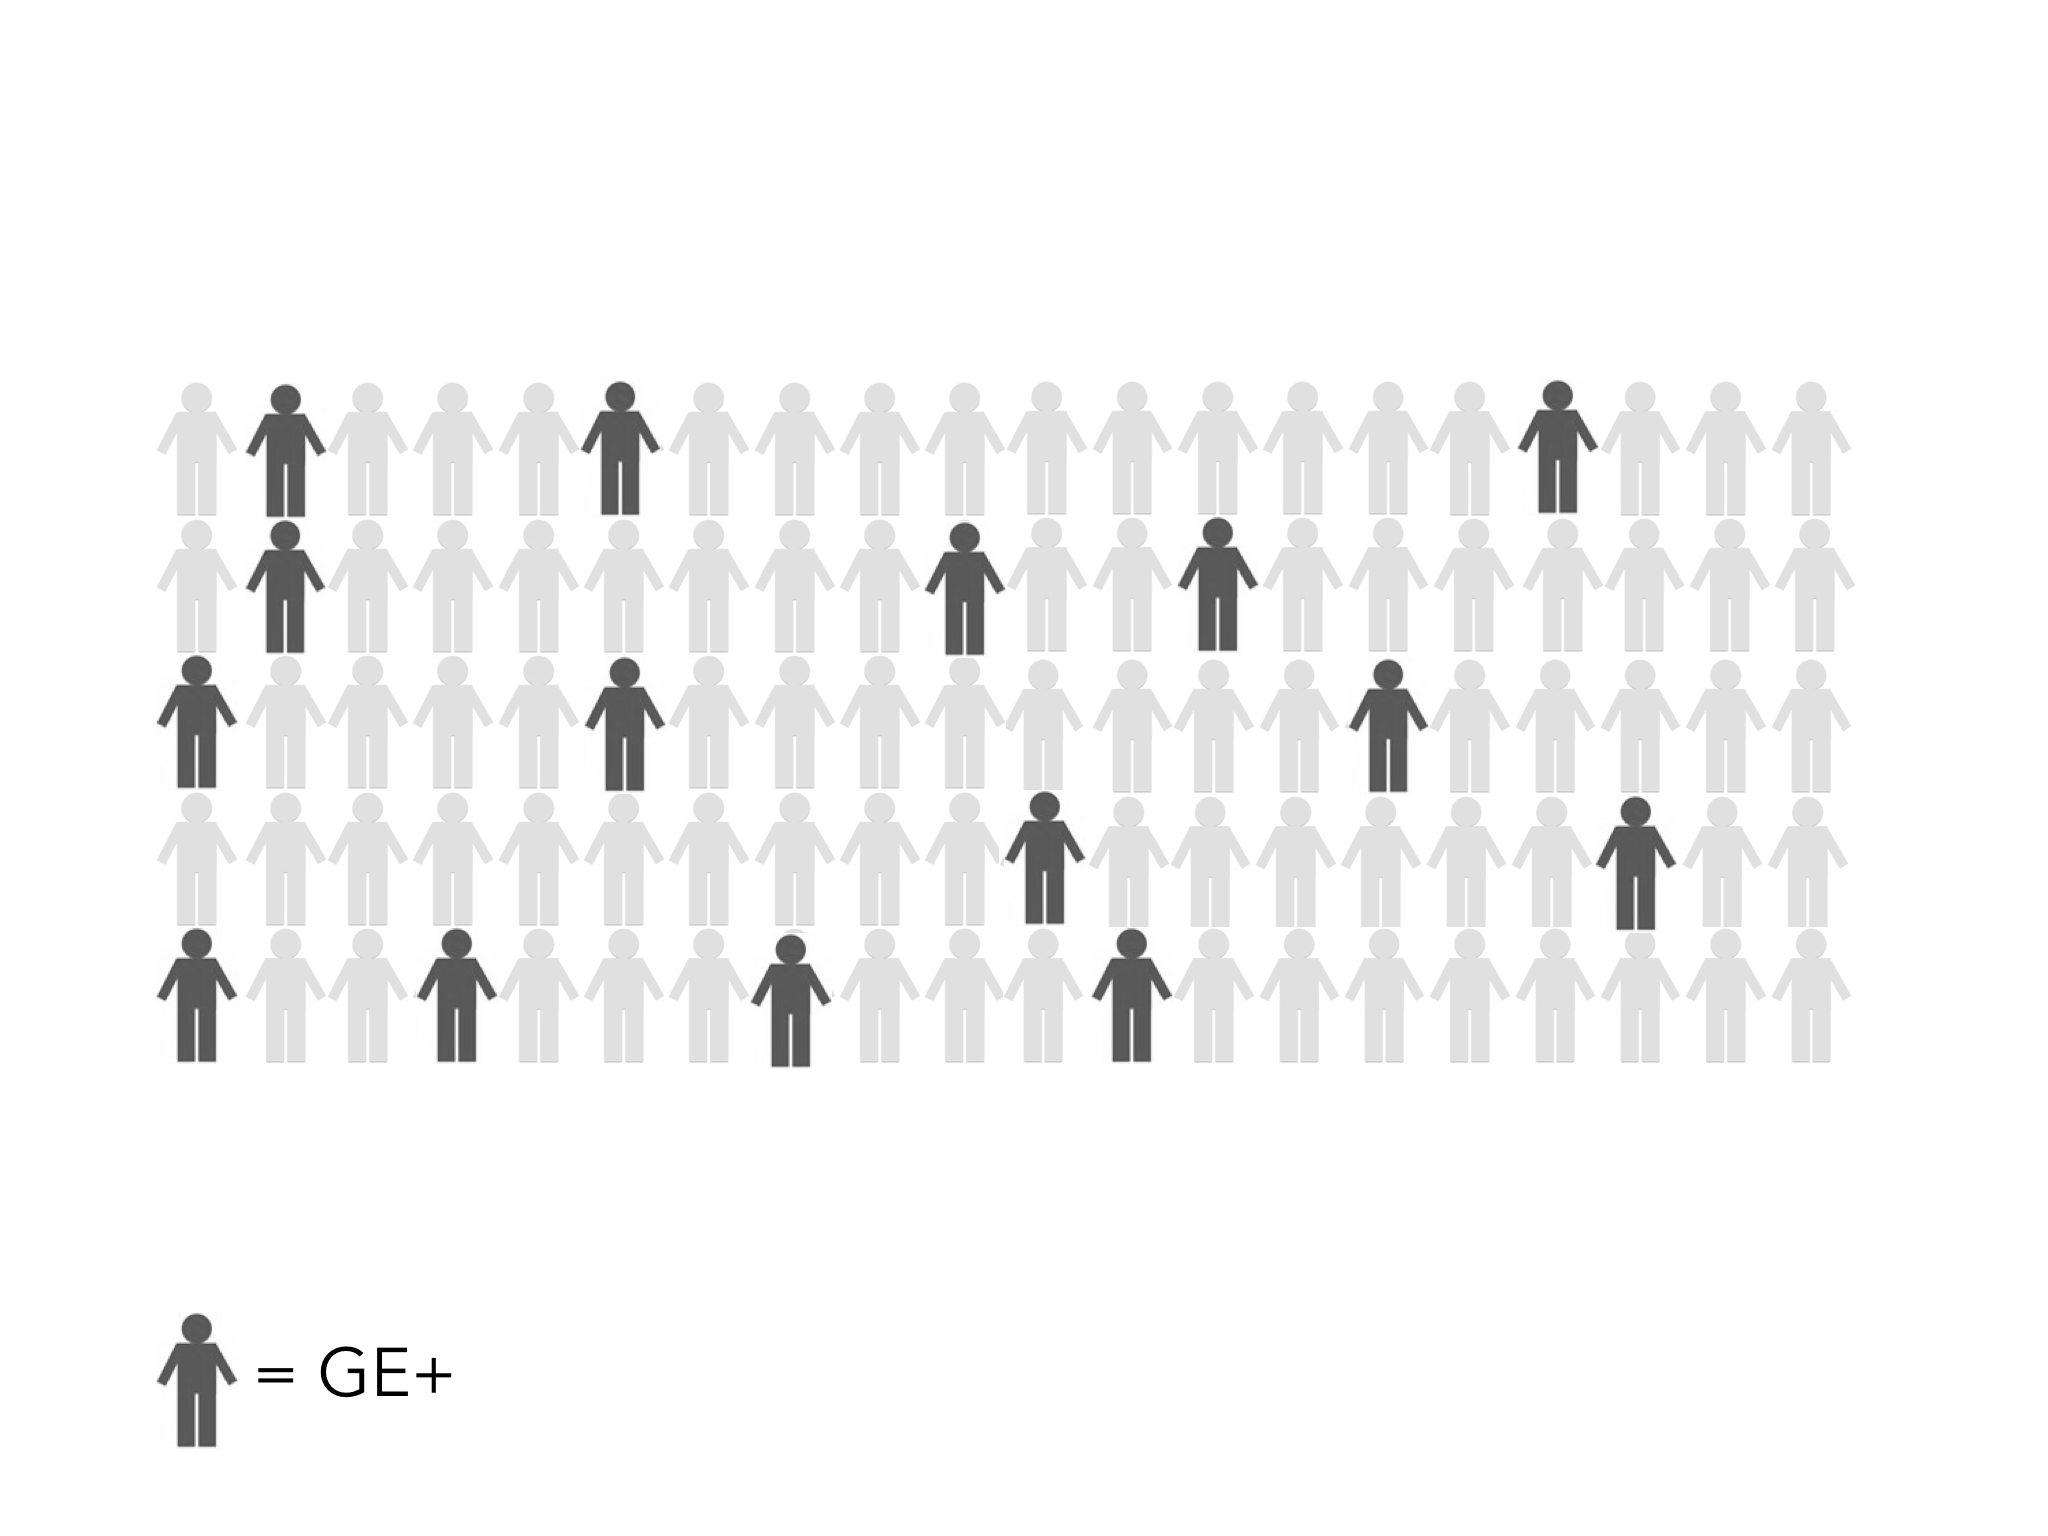
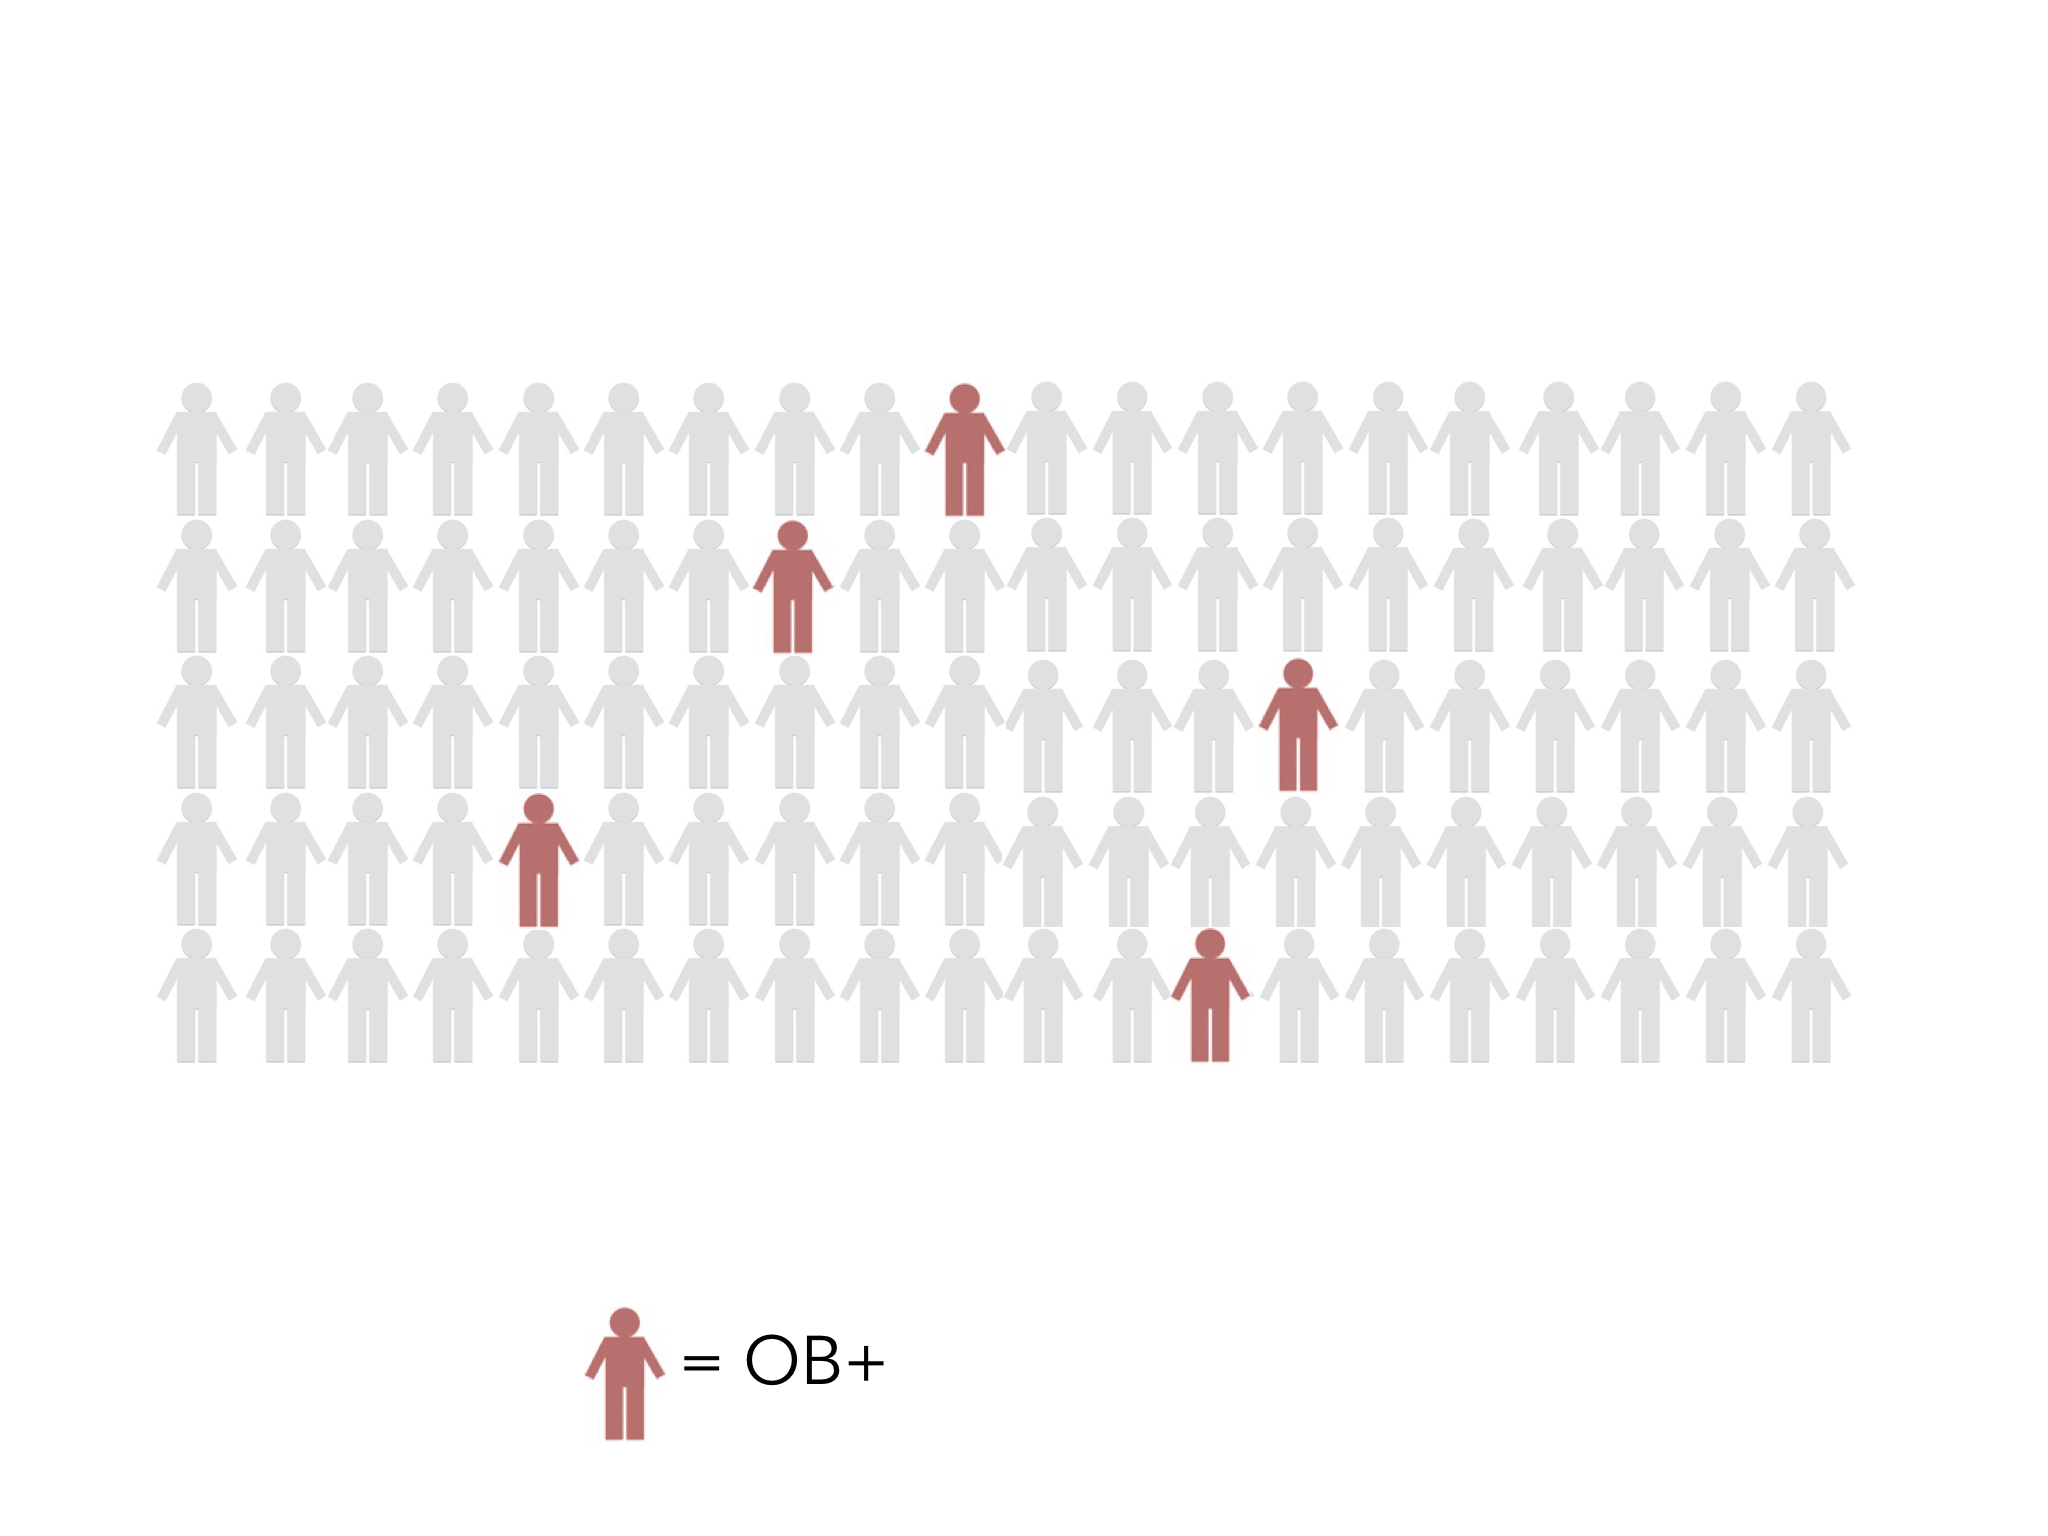
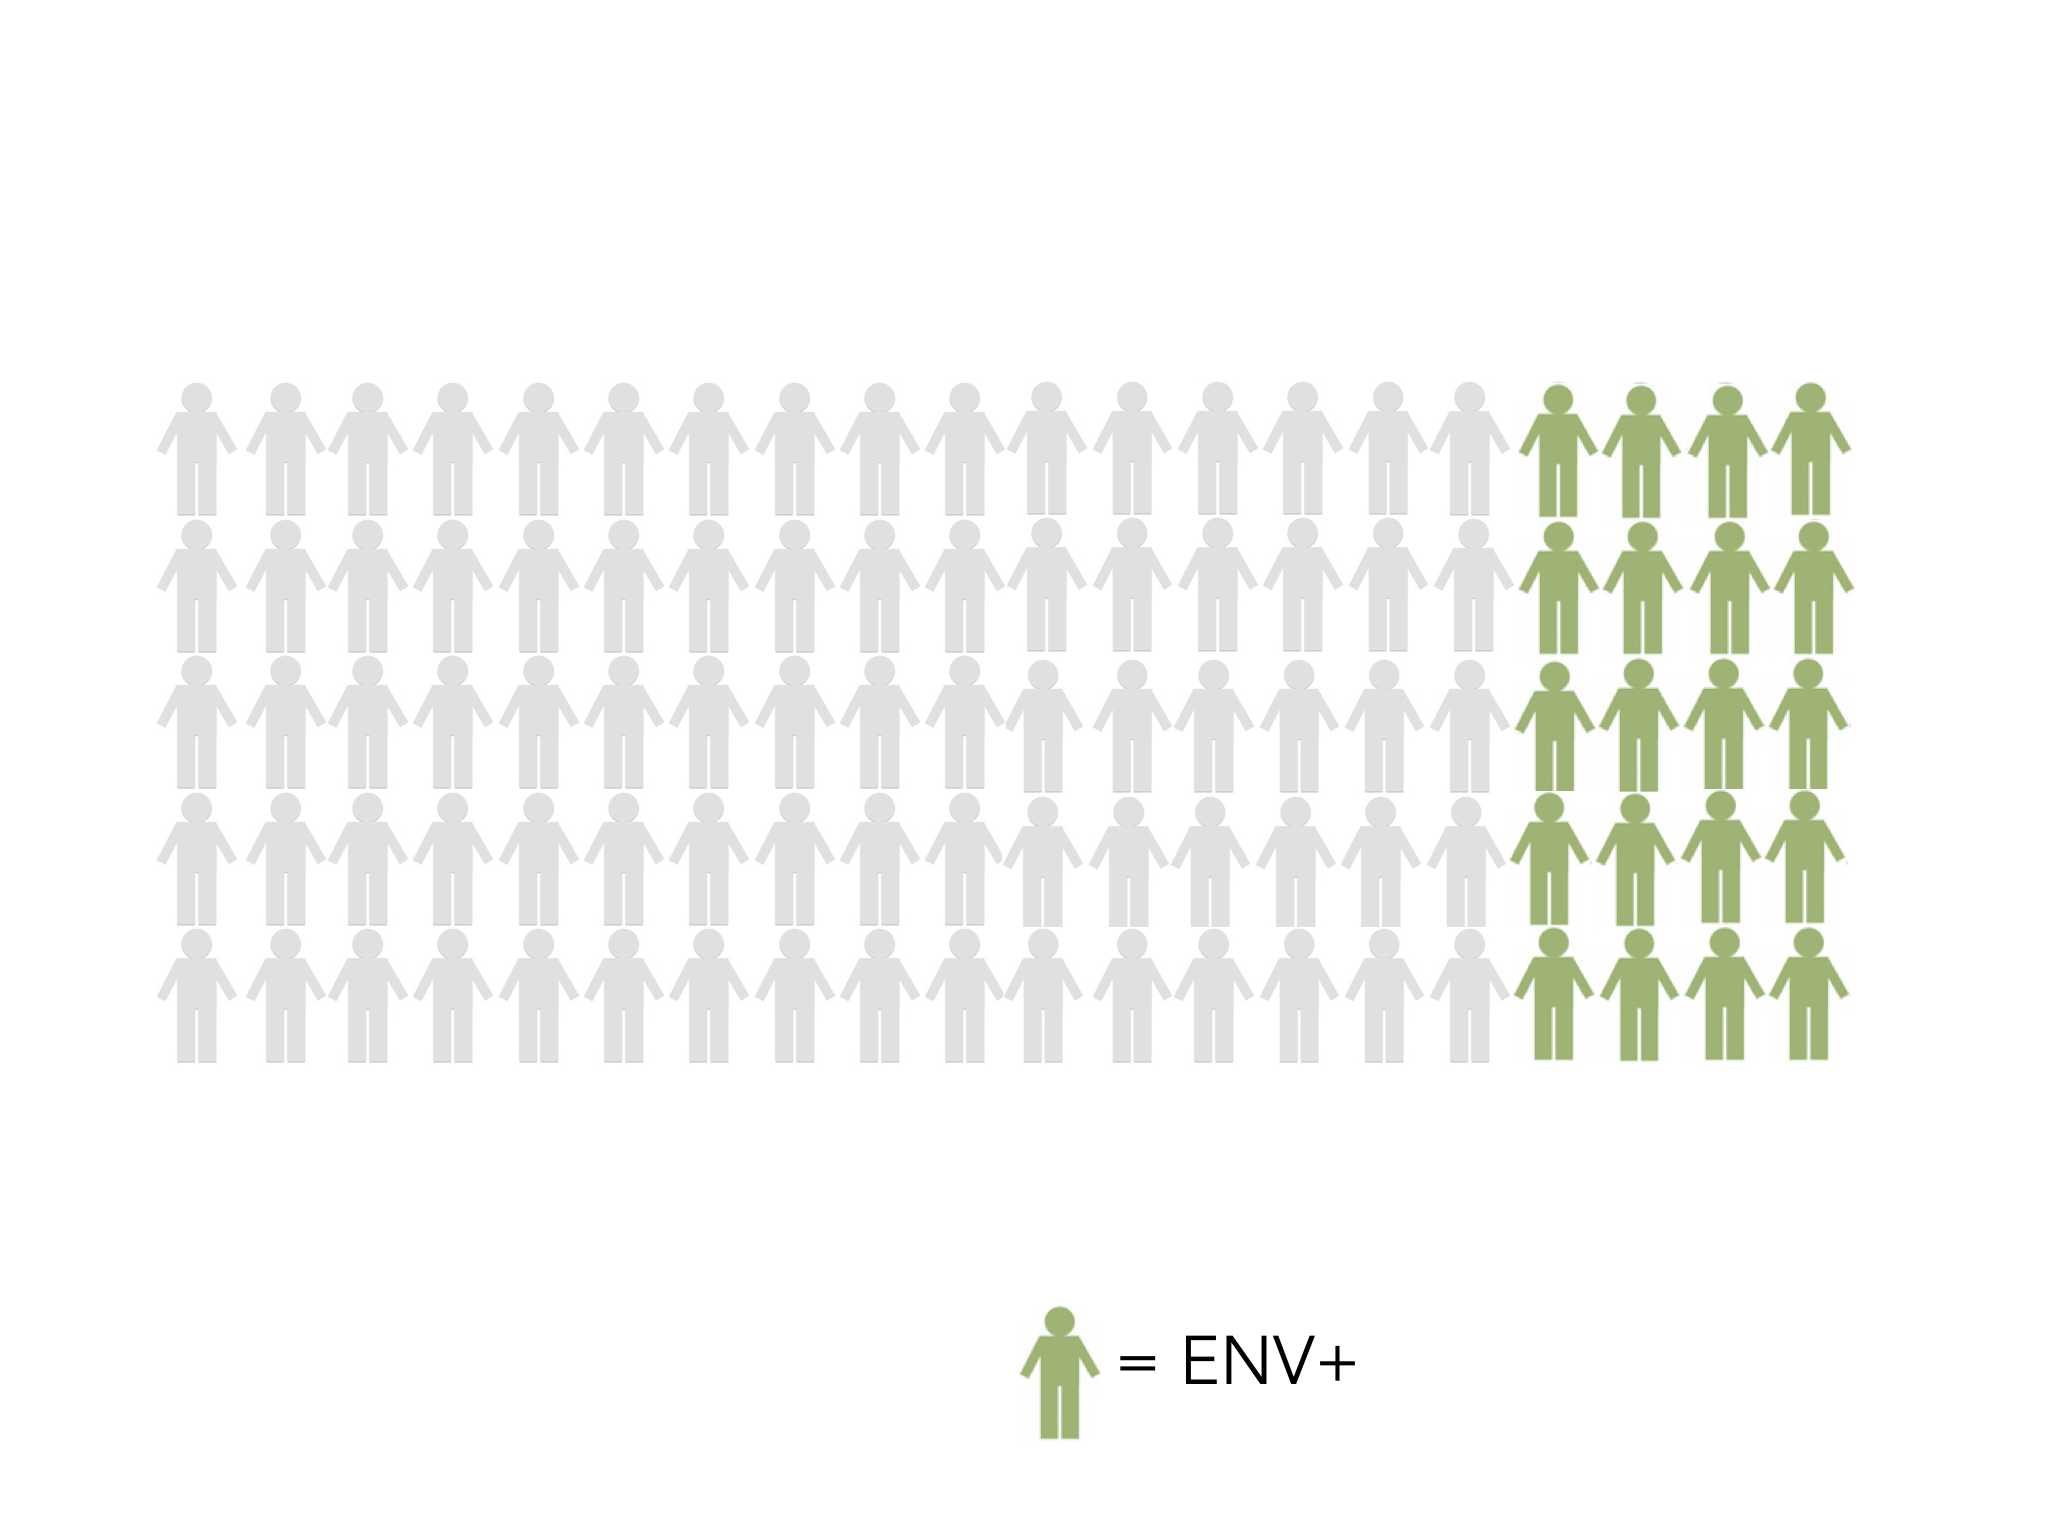
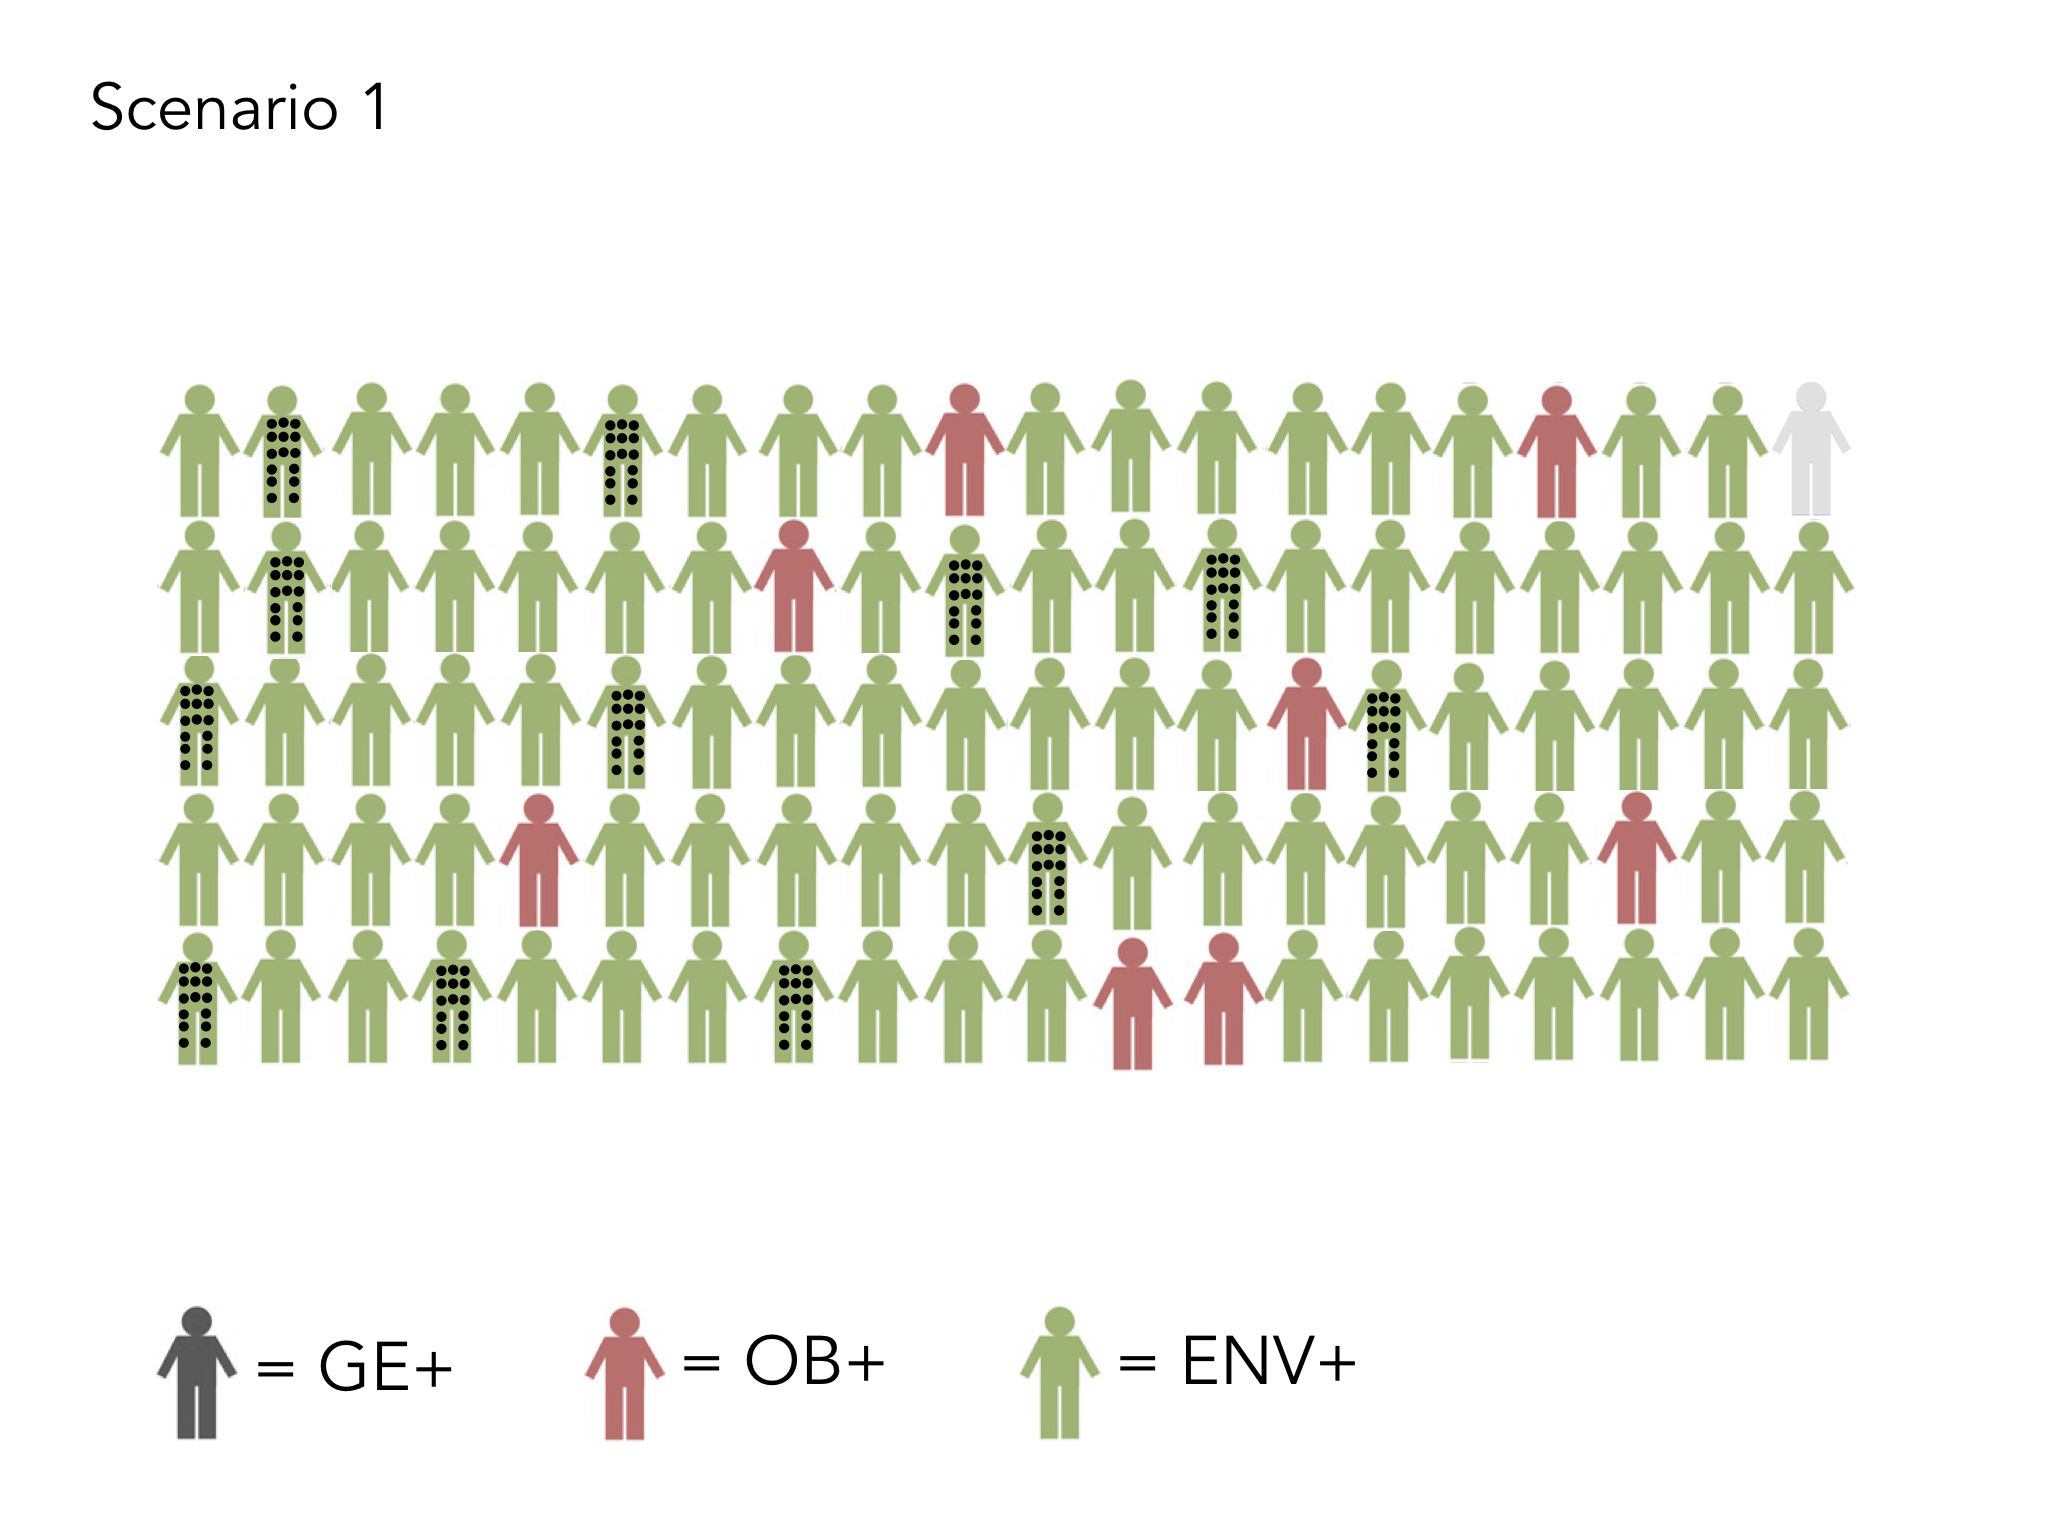
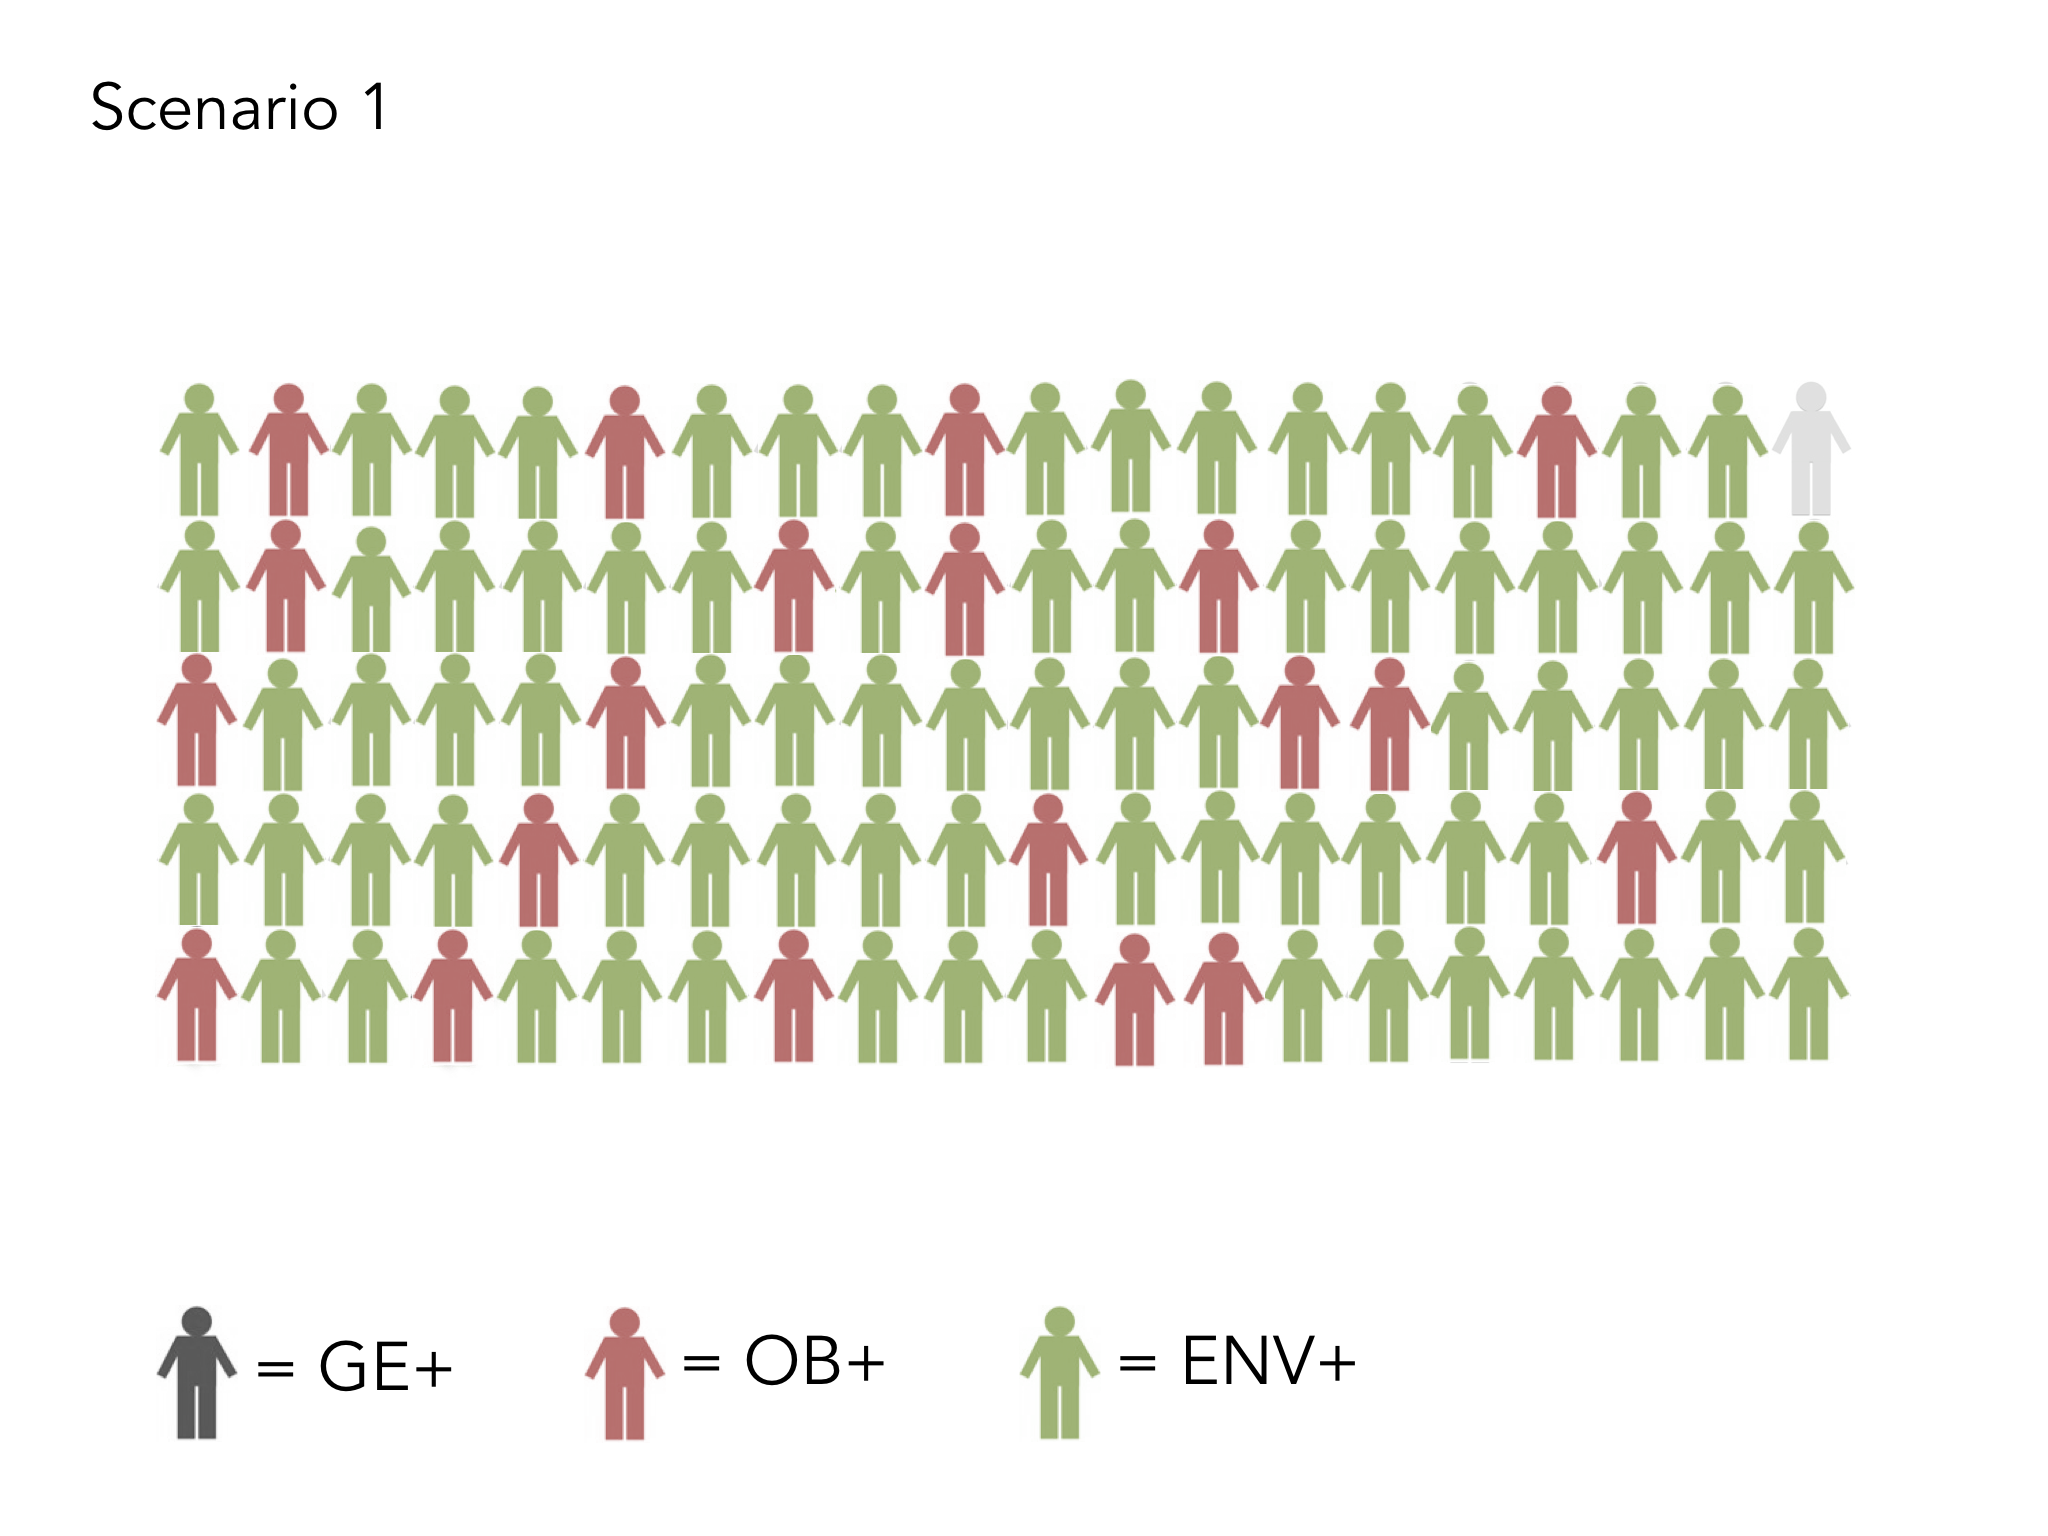
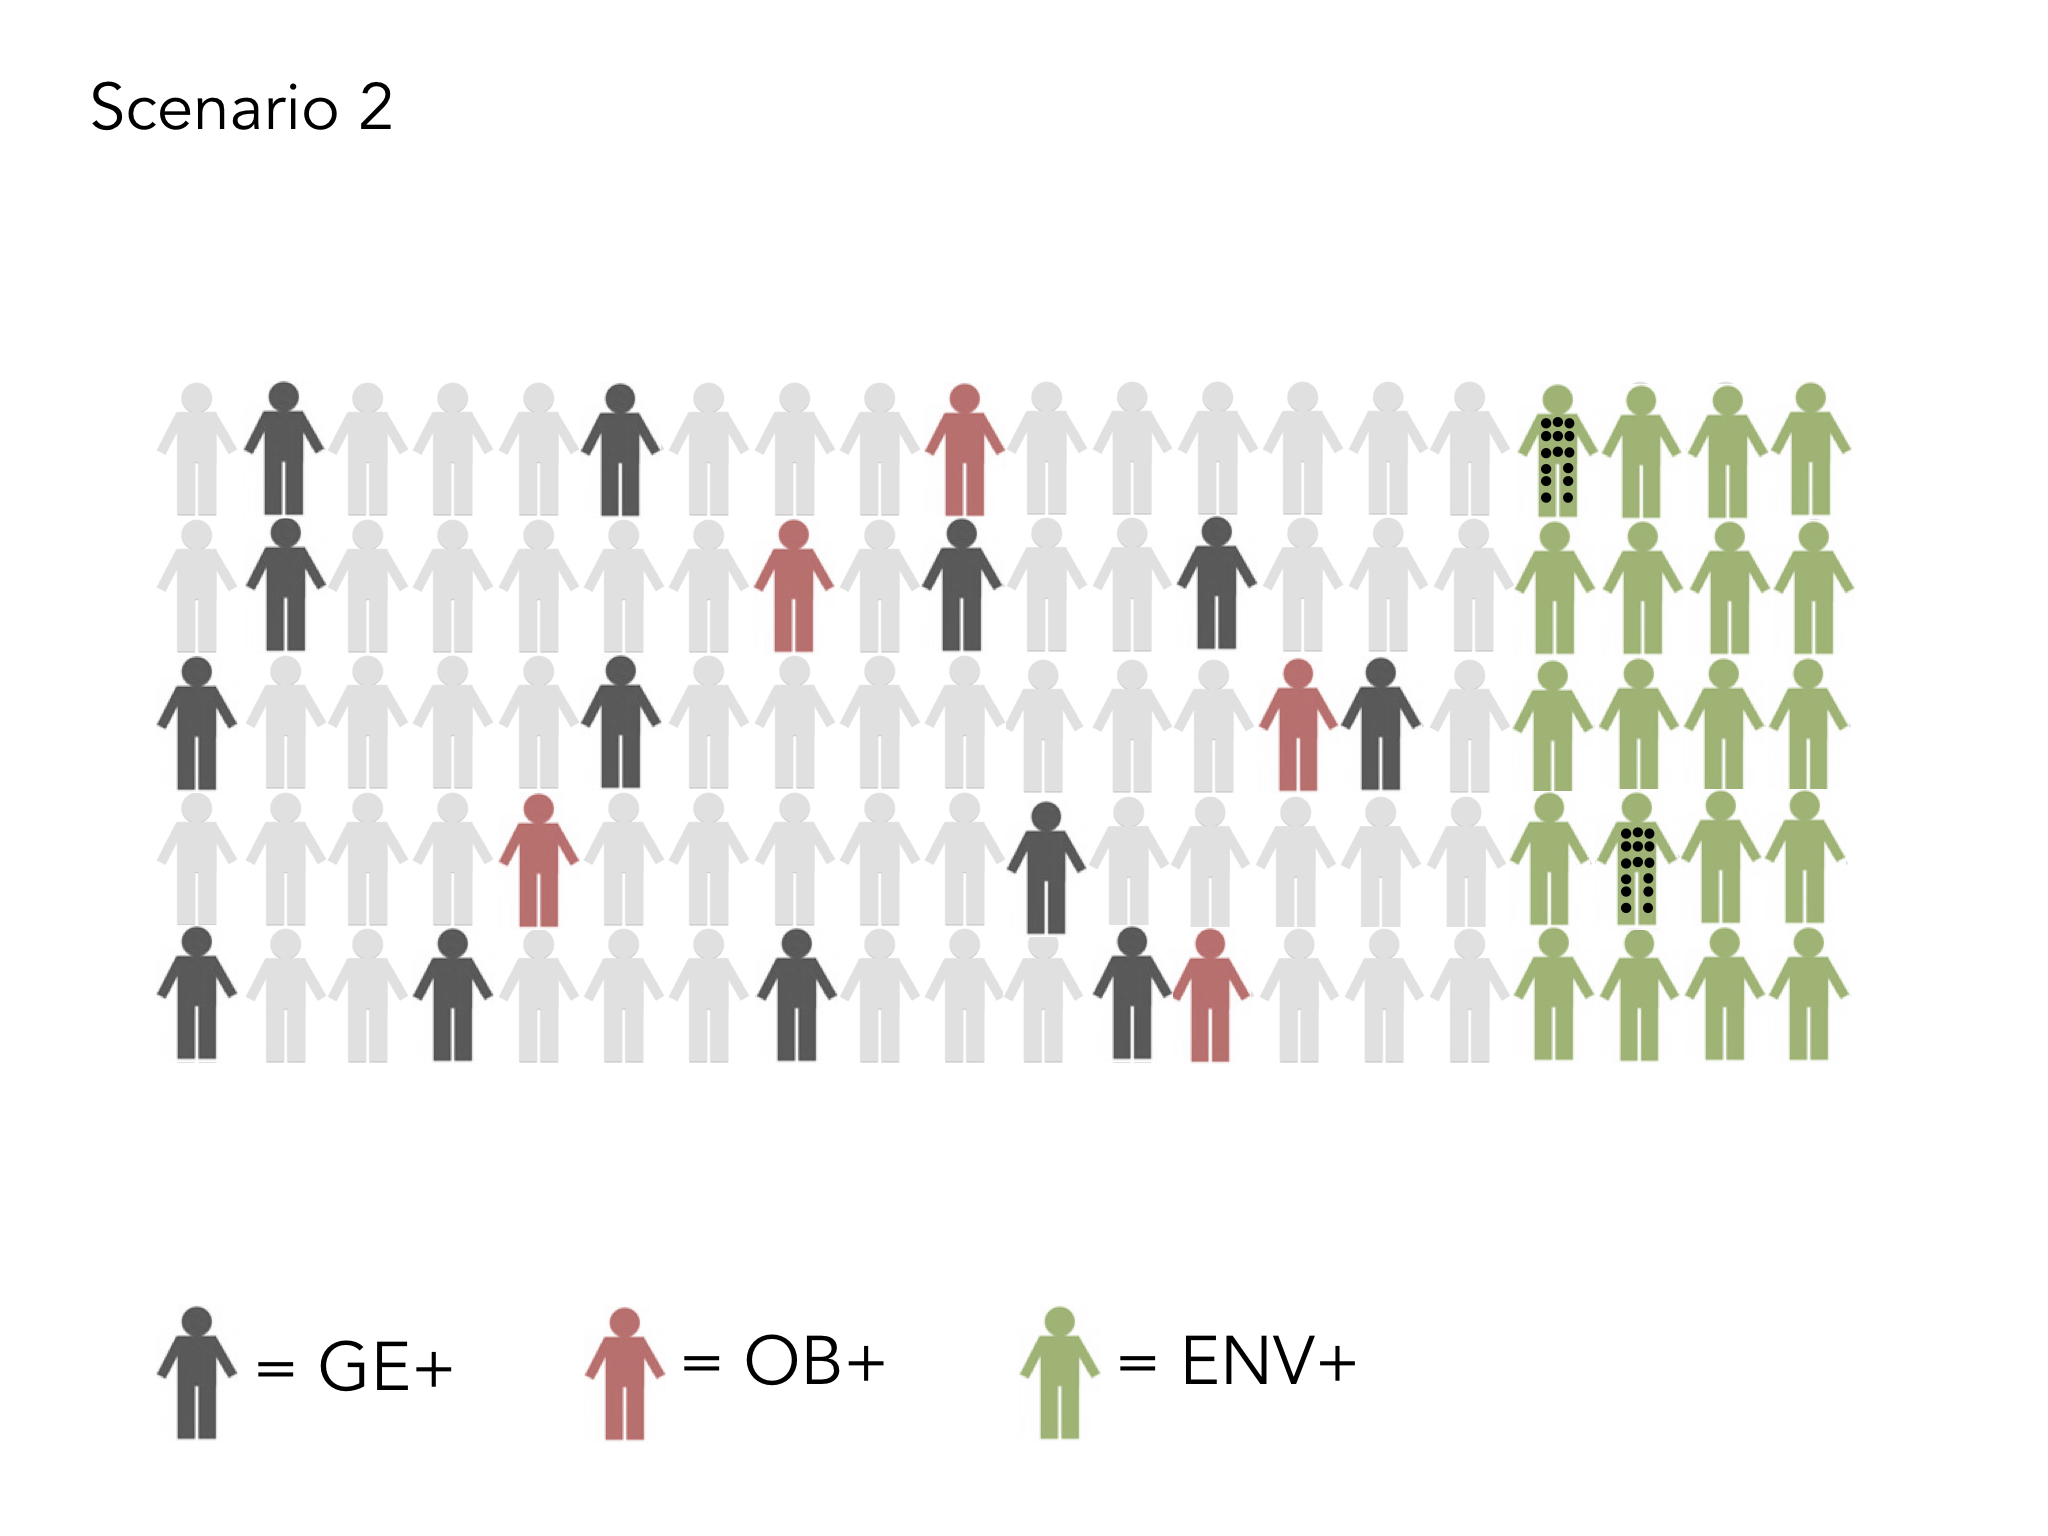
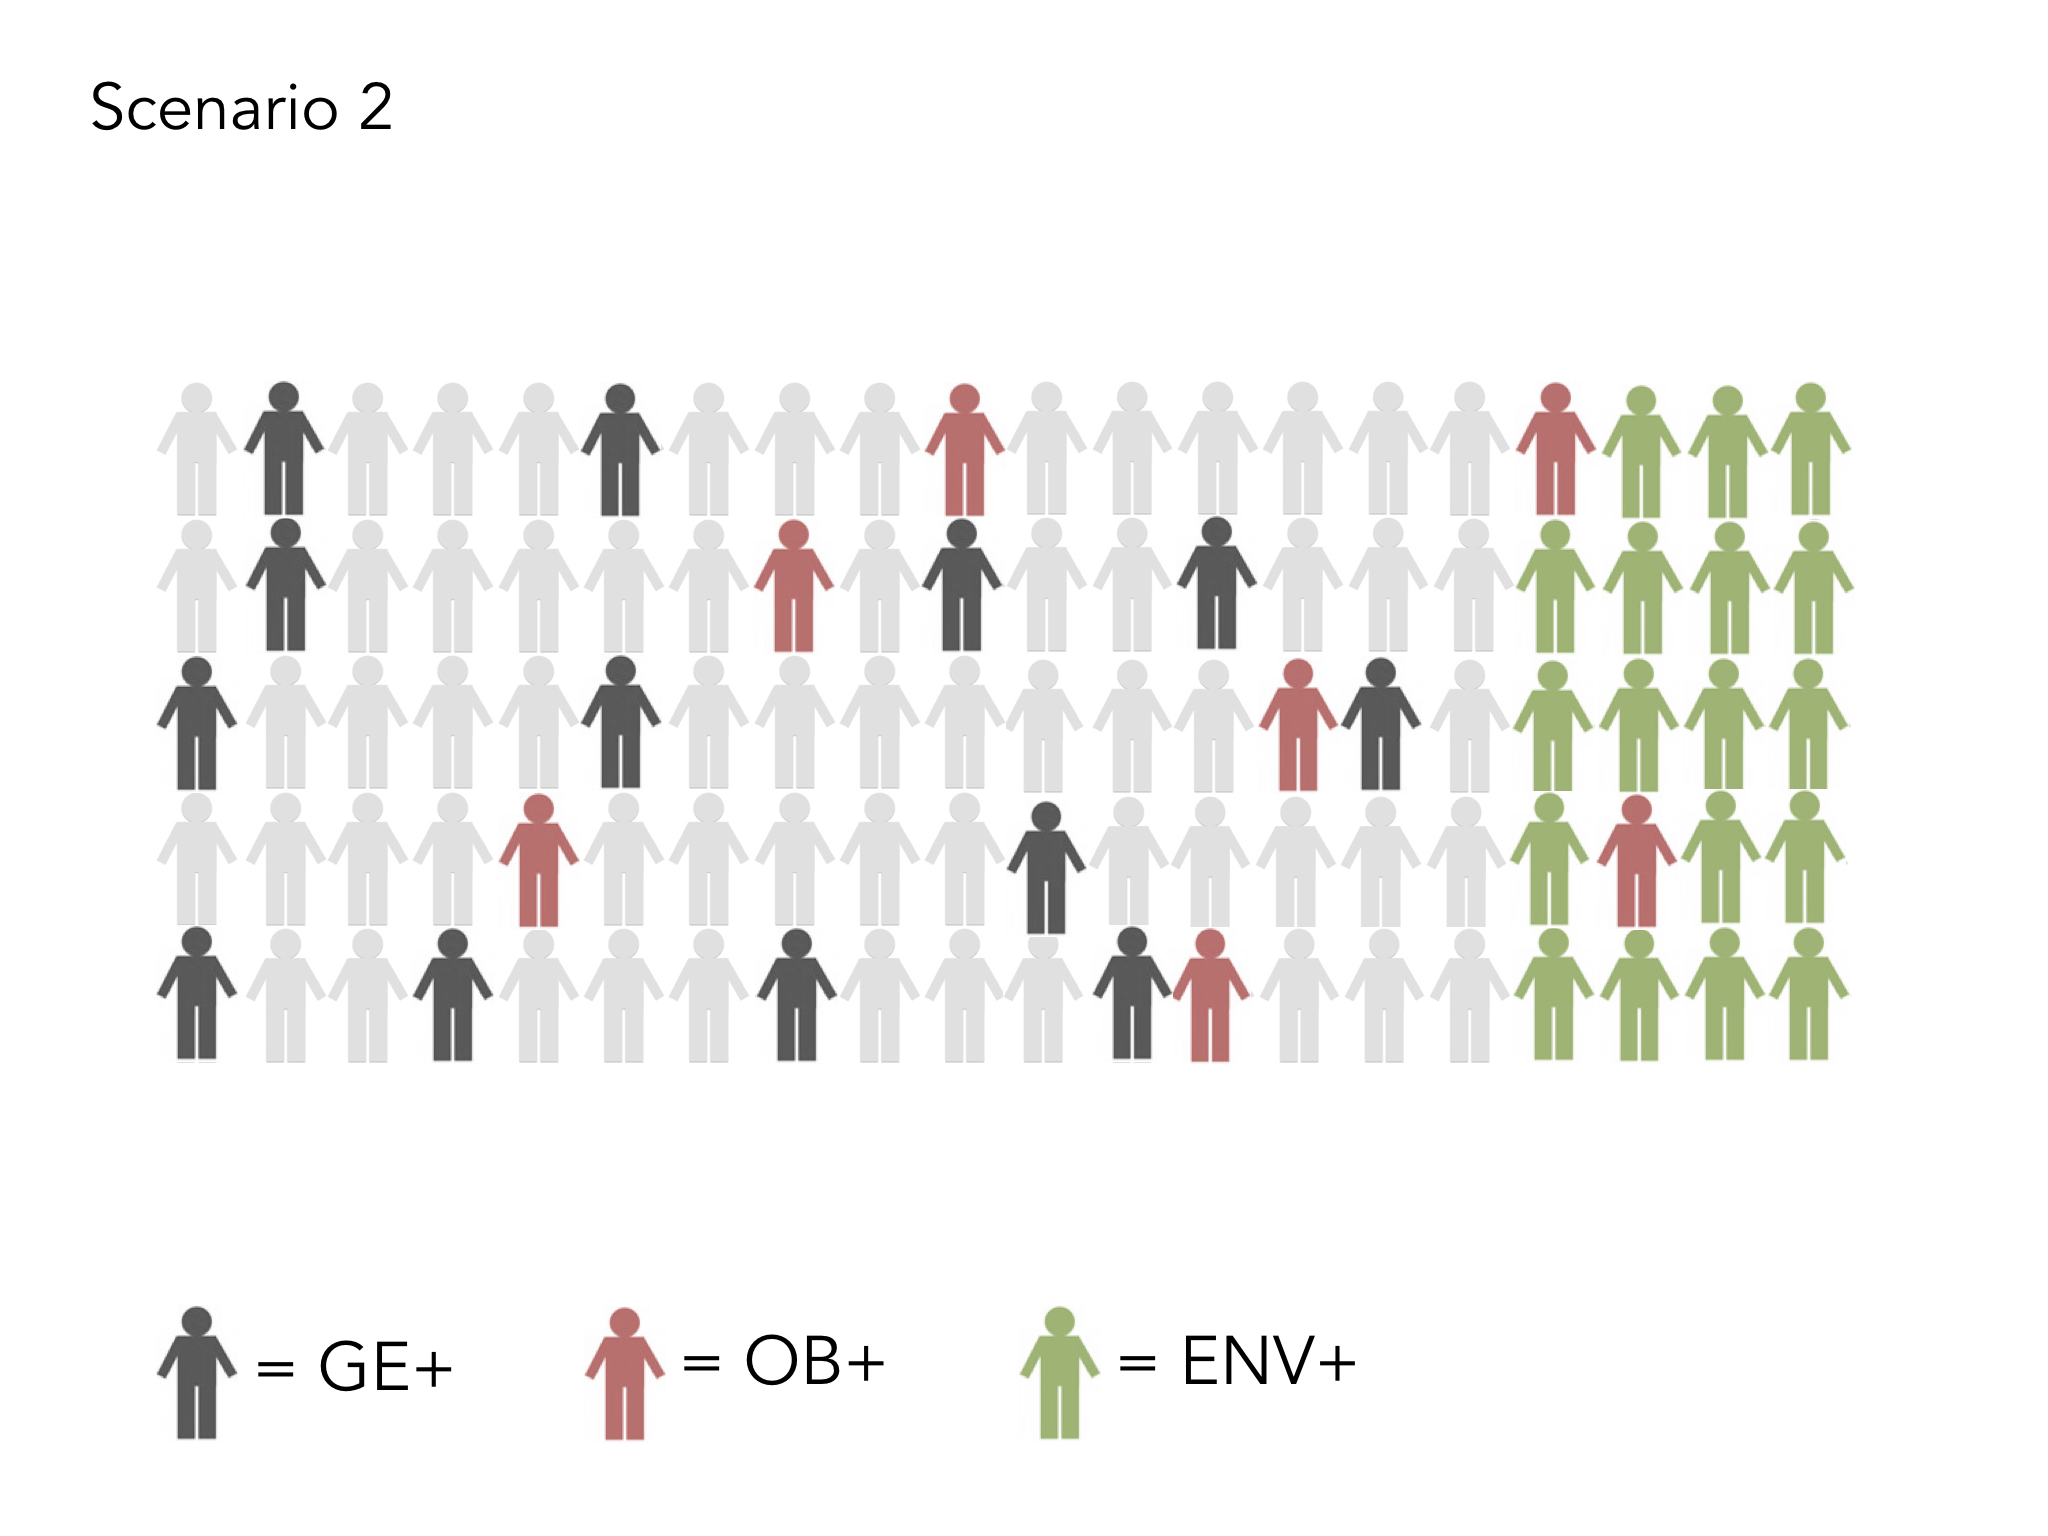
We’ve also recently done a review of how many people in each area are living with Long Term conditions. What is very interesting is that in two almost identical areas in population size (Lancaster and Morecambe), but one with significantly more areas of increased deprivation (Morecambe), people in that area have a higher number of Long Term Conditions (LTCs). However, when it comes to the allocation of resources into the Primary Care Networks, working in these two areas, this is done on the size of the population, not the complexity of what those populations are dealing with. So, even though there are far more people living with multiple LTCs in Morecambe, compared to Lancaster, they are both allocated the same number of staff through the PCNs to deal with their relative problems.
 This means that areas like Morecambe and Barrow are missing out twice over. They are not getting the money into their areas in the first place to allow them to level up on the ’causes of the causes’, as Sir Michael Marmot puts it, – i.e. they are not able to get into good preventative public health AND they are not given a fair weighting when it comes to helping those who are already living there with significantly more complex health needs. This means teams working in places like Morecambe can find it harder to recruit and their teams can suffer easier burn out, or are simply unable to provide the help to their communities that is needed. We know that economically poorer areas have higher populations of BAME citizens also, which is vital to understand if we’re serious about ‘Black Lives Matter’.
 This injustice needs to stop if we are serious about tackling health inequalities. Talk is cheap. It’s time to put our money where our mouth is. We can’t just talk about levelling up, we must do it! We need action and that action needs to take the form of a recalculated funding formula, which ensures that the communities that need the most help are able to get it. When it comes down to it, I’m a pragmatist. There are pockets of poverty, even in our wealthiest areas and issues like frailty can make the provision of care more expensive (though one could argue that in poorer areas, we’re dealing with frailty 10-20 years before it is seen in wealthier populations). So…..we need to do two things:
- We need to change the way funding is given through the Primary Care Networks to ensure that those who have the greatest task, get the greatest help. This needs prioritising by the national leadership team.
- We need to ensure that we create a funding formula from the National Team into the Integrated Care Systems in each of the regions and then within each ICS that recognises the complexities we’re dealing with when trying to level up. The funding formula based on IMD (either lowest 10 or 20%) is indeed quite extreme – perhaps it needs to be. Perhaps a more realistic formula is to to weight it 50:50, with half of it calculated according to the lowest 20% IMD and half according to the Carr-Hill Weighted formula. This has gained broad support across the board in our part of the world. We call it the Morecambe Bay formula (though it is with huge thanks to Mark Wight and Anji Stokes!). We believe it is far more socially just.

